← All work

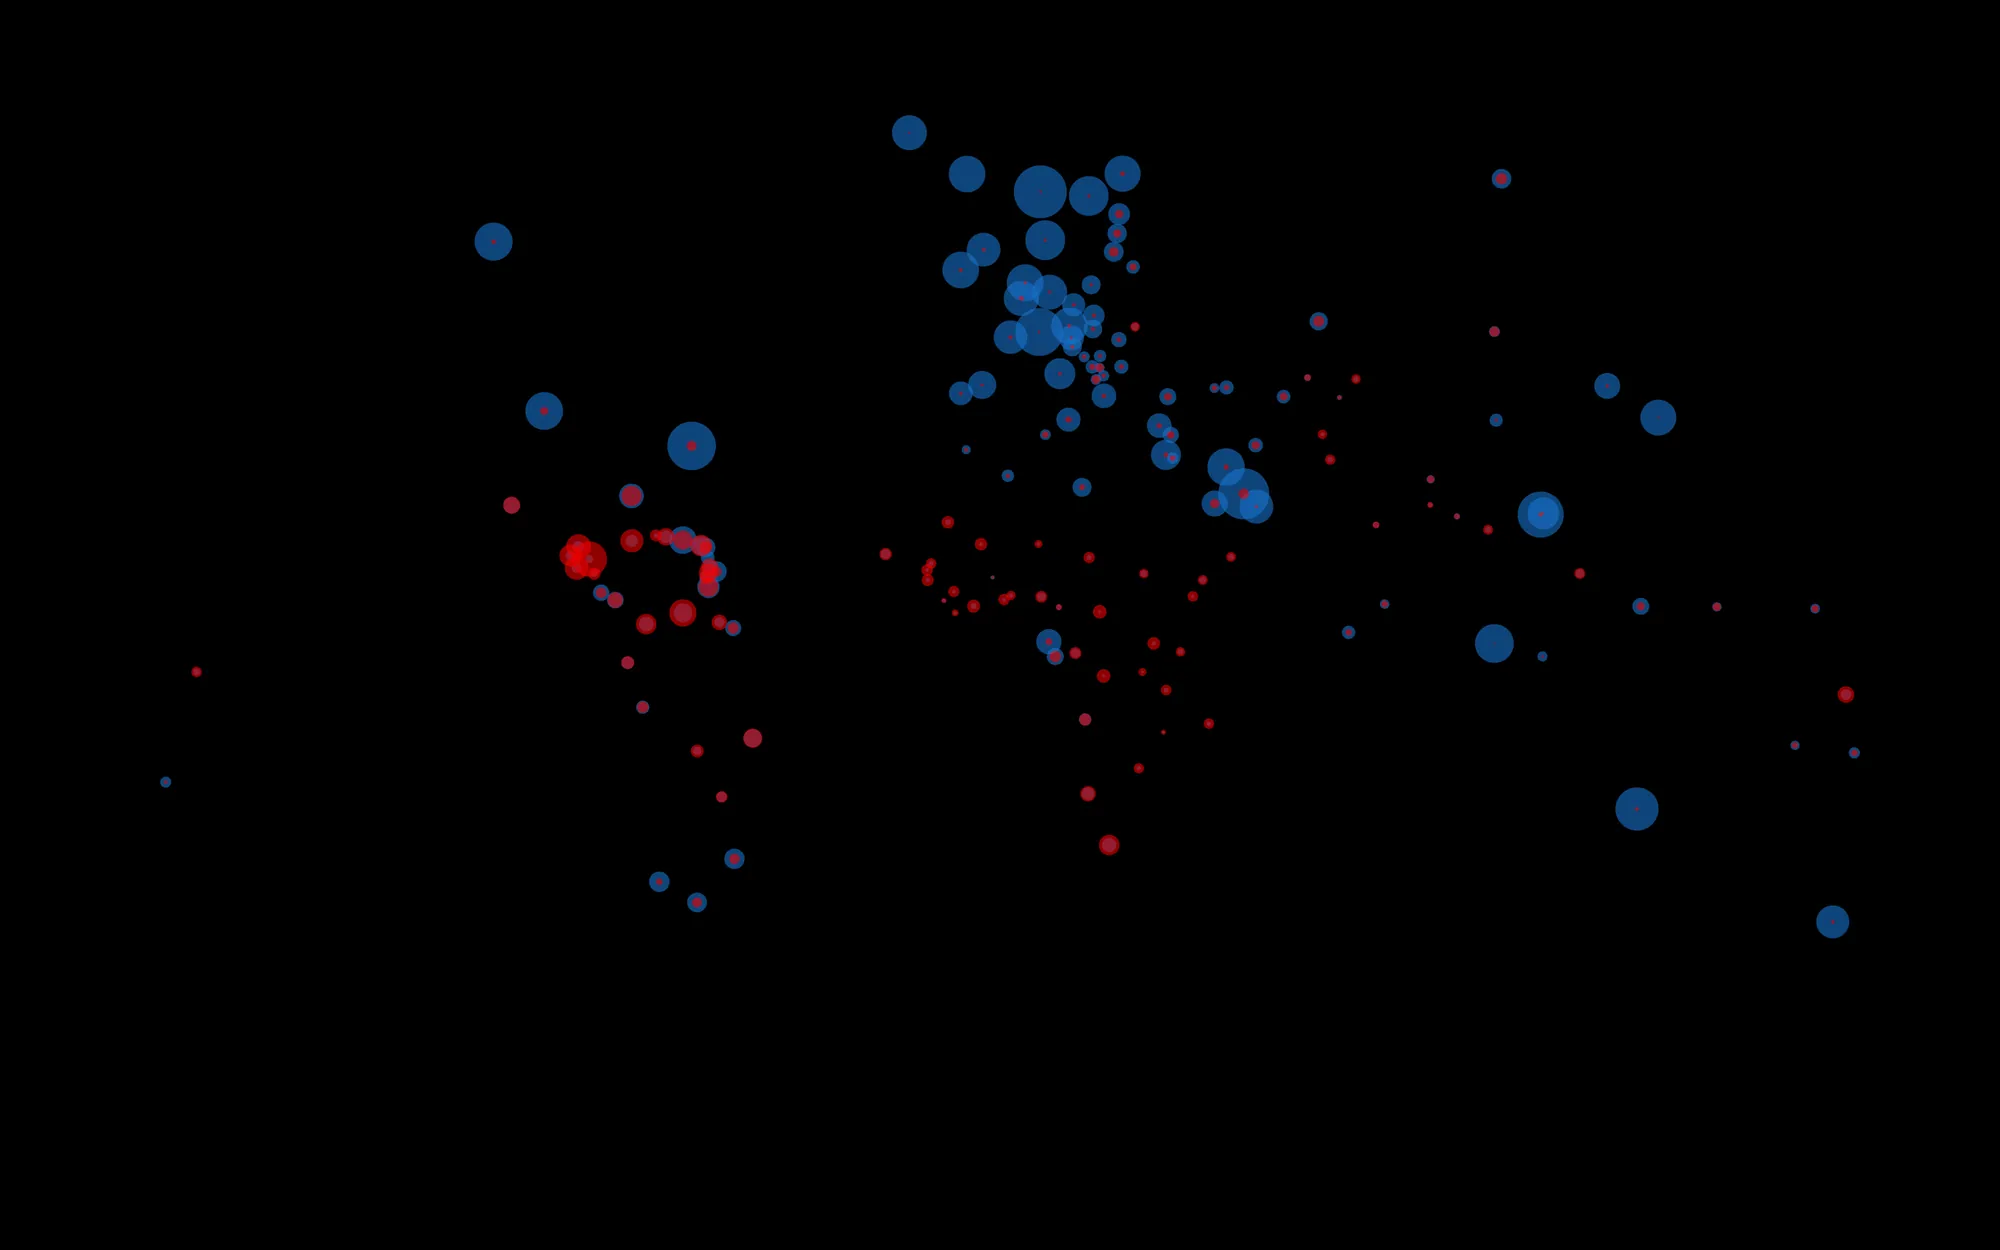
The world in wealth and murder

Generative Design · HfG · 2016

An interactive data visualisation that puts GDP and homicide rates for every country on one map, built from real data in JavaScript.

World map made of blue and red circles
Role
Solo: data collection, code and design.
Lecturer
Prof. Hartmut Bohnacker
Tech
Geo + statistics → JSON → SVG / JavaScript
Context
Generative Design, 2nd semester, summer 2016

What I built

I collected real geo data plus GDP and homicide statistics, converted them to JSON and drew every country as circles whose area is proportional to the data.

  1. ClickSelect any country circle and add more to compare them.
  2. ← / →Sort by the richest countries or by the highest murder rate.
  3. ↓Return to the map.

Try it

Best on desktop with a keyboard. Open full screen